• Is WesBanco a Prime Undervalued Stock Right Now?

    When trying to pick a stock to achieve alpha and find absolute returns, regardless of market movements, you would look for indicator misgivings that do not truly reflect the intrinsic value of a stock. You would need to search for an opportunity where the street-wide view is wrong, and accordingly sustain a variant view, and search for a stock that is undervalued.  

    This could be achieved by identifying inefficiencies, (such as information gap or low liquidity) mispricings, asymmetric risk/reward, and companies with high dispersion resulting in significant performance differences. It could be a catalyst driver, such as earnings reports, analyst ratings revisions, product launches, regulatory approvals or changes, M&A or spin-off companies, or industry data reflection. 

    WesBanco may be a prime option for this. Evidence presented here will support the conviction that WesBanco is quietly trading at a discount, while other brand names are taking up the market’s attention. 

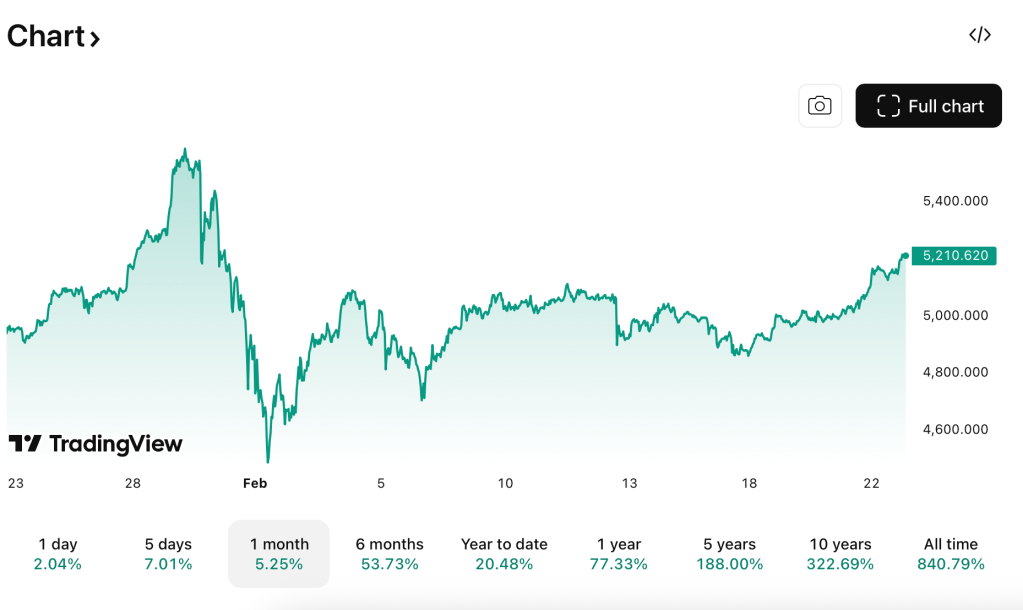
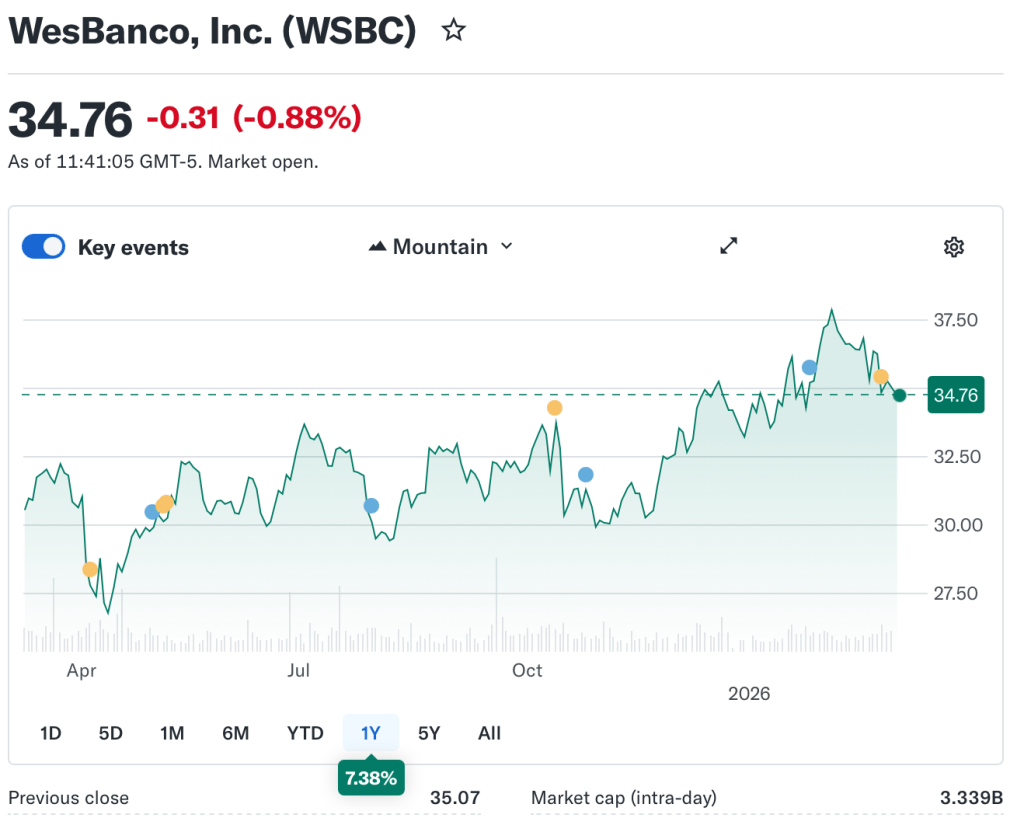
    WesBanco is a mid-cap American regional banking holding company, founded in 1870 based in West Virginia. Through a sturdy number of acquisitions, it has built a strong presence in nine states: Kentucky, Maryland, Michigan, Ohio, Pennsylvania, Tennessee, Virginia, and West Virginia. Their business model focuses on community and retail banking, commercial banking, plus wealth and trust services. The company services 400,000 customers, and 50,000 business relationships. The market cap is 3.41 billion USD, with a share price of 34.76 USD, which over the past year has only increase 1.34%. The 1-year estimate is $40.50. 

    Yahoo Finance ranked Wesbanco as one of the top US equities trading at the highest discount rate, currently at 47.7%, with an estimated fair value of $68.84. The fair value figure displays an estimated ‘true intrinsic’ value of stock based on fundamental analysis, earnings, growth and assets. 

    Assessing first the stock data, the EPS share is a favourable position with the full year adjusted $3.40, a 45% YonY from the previous year (or $2.33 diluted EPS). EPS for Q4 2025 was $0.84, which is up 18% YonY. EPS is net income divided by shares outstanding; it tells of how profitable the company is per share. EPS is not just a static figure to be taken objectively; EPS quality should be considered. EPS YonY growth, 3-5 EPS CAGR, and forward EPS estimates can also be looked at, to give a broad subjective view. An EPS could be flat for 5 years, but to achieve alpha these figures could be considered to conclude a subjective view on an equity. Wesbanco has strong EPS YoY growth as evidenced.  

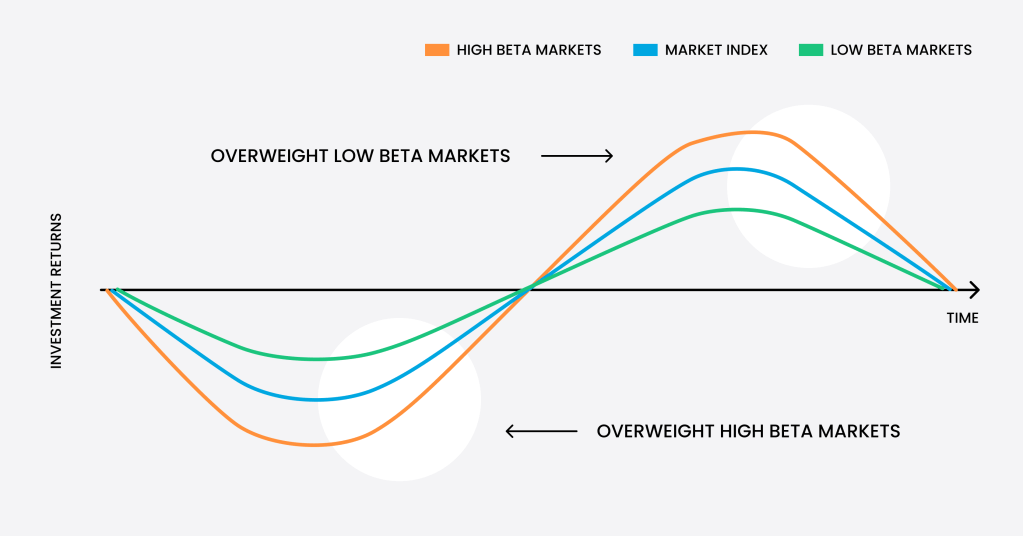
    Considering other markets’ measurable data, Wesbanco’s 5-year monthly beta is 0.78. This beta measure being below 1, means Wesbanco stock has been less volatile over the past 60 months of trading, compared to the market average. Accordingly, with the aim of generating risk-adjusted returns, based on the beta, Wesbanco offers lower systemic risk stocks, during a bearish market in times of market volatility than other stocks. However, from the lens of an asset manager, Wesbanco may not be seen as a strong macro beta play. Although the downside of this equity and low beta position is a regional bank may be highly sensitive to interest rates and credit spreads.  

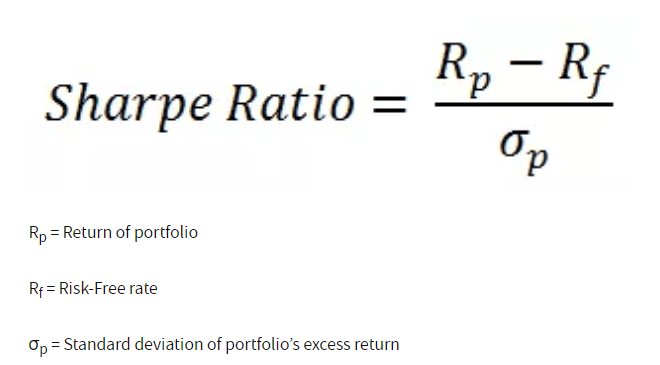
    Wesbanco records a 1-year Sharpe ratio of -0.53-, and a 5-year Sharpe ratio of +0.31. The former negative ratio translates into on paper that investing in this stock in the short term, means you are taking on a high volatile risk for a return lower than what you would get for a guaranteed, risk free or very low risk investment.  The 5-year latter ratio being positive displays a slightly different picture over the long term, the stock risk adjusted returns are somewhat mildly better. If the 5-year beta were above 1.0 or 2.0, this would be considered very good. For example, if WesBanco returns 12% over the next five years with a beta of +0.31, but another stilled returned 12% but with a beta of +0.05, Wesbanco would be deemed superior, from an asset manager’s perspective. 

    However, when only downside risk is analysed with the sortino ratio, the 1-year sortino ratio is at -0.84 is much lower. Sharpe ratio considers the total volatility to the market, Sortino considers only downside volatility. The sortino ratio should not be taken as objectively bad. The important caveat is comparing this to see if this was sector-wide or company specific. Looking at other US regional banks such as, M&T Bank, has a 1-year sortino of -1.12, KRE with -0.56, a BB bank, Bank of America with -1.52. Potentially this downside volatility is normalising and may be due to banks often being sensitive to depositor confidence. Additionally, a 1-year negative sortino can often reflect stress or sector rotation and be less representative of structural underperformance. 

    The high forward dividend and yield of 4.31%, with an estimated payout of $1.52 per share. The forward dividend is high which compared to S&P 500 usually sits around 1-2%, but a 4-6% yield is common for stable regional banks. The PE ratio (TTM) of 15.53 for a stock is considered good, higher than average for the banking sector. Investopedia reports that the P/E of major US national banks, is on average 8.46, with smaller regional banks on average being 13.50. The P/E ratio can tell a narrative of how much investors are willing to pay for every dollar of profit a company will deliver. This slightly higher figure for WesBanco infers that investors expect high growth rates. 

    In terms of earnings growth potential for the company, the completion of the acquisition of Premier Financial Corp, worth $959m in an all-stock deal in early last year, the company expects synergies and EPS accretion to deliver. Wesbanco projects $1.7 billion revenue, in tandem with its earnings to boost its earnings from $125.2 million to $821.3 million. This equates to a 35.2% revenue growth. This is possible since, the bank’s annualised revenue growth has upped 27.4% over the last two years, which is as such higher than its five-year trend. Yahoo Finance affirms demand has accelerated for the bank. 

    However, intrinsic risk that may stop the bank achieving its projects is its high commercial real estate exposure. As of December 2025, the banks total assets grew to $27.7 billion, with total portfolio loans equalling $19.2 million, with Commercial Real estate payoffs, coming to $905 million for the year 2025. Contestably, the bank’s concentrated regional footing, in the Midwest, may make the firm vulnerable to regional economic downturns. 

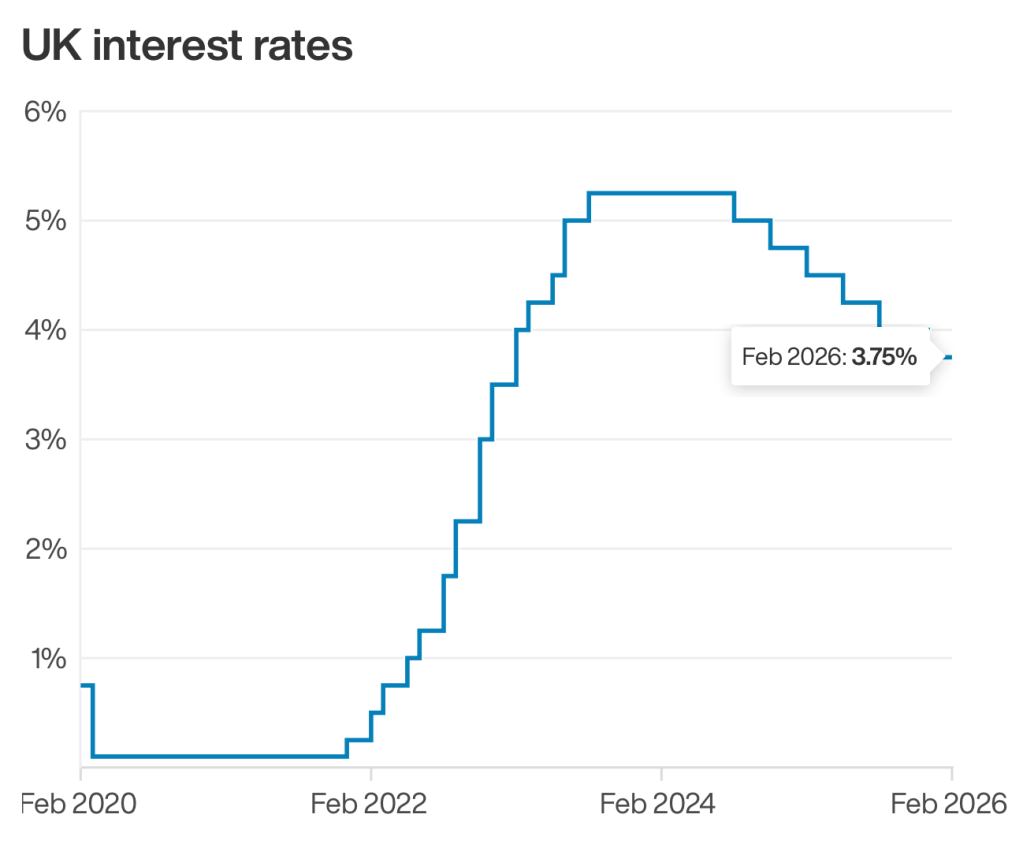
    In rebuttal to this, the regional positioning may aid as a growth factor for Wesbanco, when tied to the expectation of two more 25bps rate cuts expected by the Fed for the US for this year. Regional banks can benefit from steady monetary policy loosening, when the interest earnt on loans, and the net interest margin (essentially the interest they pay on deposits) holds up. If the loosening is steady, this means Wesbanco will be able to maintain healthy margins, whilst credit demand picks up. This rate cut aligns with continued economic growth tin he US expected for 2026, supporting especially consumer confidence and business spending, helping service a bank with this focus. 

    To conclude, WesBanco presents a compelling and nuanced case for a potentially undervalued regional banking equity. With strong financial growth projections, and expectations the stock with rise in value evidenced by full year adjusted EPS of $3.40, a 45% YonY from the previous year, forward dividend and yield of 4.31% with a payout of $1.52 a share. The potential mitigants to take into consideration in your own assessment include the negative 1-year Sharpe ratio and negative 1-year Sortino ratio, while too the commercial real estate exposure. However, this may be nulled by the immersion of its acquisition with Premier Financial Corp, which could help it achieve its ambitious earnings goal of $821.3 million. 

    Disclaimer: Not financial advice 

    Sources: 

    https://www.investopedia.com/terms/d/dividendyield.asp

    https://simplywall.st/stocks/us/banks/nasdaq-wsbc/wesbanco/news/how-wesbancos-wsbc-new-shelf-registration-and-dividend-reaff

    https://www.investopedia.com/ask/answers/040815/what-average-pricetoearnings-ratio-banking-sector.asp#:~:text=The%20P/E%20of%20the,closer%20to%20typical%20market%20performance.

    https://finance.yahoo.com/news/february-2026s-value-picks-stocks-113805029.html

    https://www.home.saxo/learn/guides/financial-literacy/price-to-earnings-ratio-explained-what-it-is-and-how-to-use-it#:~:text=20–40%20(higher%20P/,stable%20and%20have%20slower%20growth).

    https://uk.finance.yahoo.com/quote/WSBC/

    https://www.tipranks.com/news/catalyst/why-wesbanco-shares-are-sliding-despite-buy-ratings

    https://finance.yahoo.com/news/still-value-wesbanco-recent-share-150724648.html

    https://finance.yahoo.com/news/makes-wesbanco-wsbc-investment-choice-142142349.html

    https://uk.investing.com/news/analyst-ratings/wesbanco-stock-rating-reiterated-at-outperform-by-kbw-citing-undervaluation-93CH-4278354

    https://simplywall.st/stocks/us/banks/nasdaq-wsbc/wesbanco/news/how-wesbancos-wsbc-new-shelf-registration-and-dividend-reaff/amp

  • How do Hedge Funds Operate
    • What are Hedge Funds?

    Hedge funds sit on the buy-side of the financial services industry, which also pertains to asset managers, pension funds, private equity firms. Their mission is on a futile level to buy securities and to invest capital to generate returns for clients. Whereas on the sell-side, the entities are financial institutions, such as investment banks, elite boutiques, and brokers, with the core basic aim of essentially trying to sell a service. 

    • History:

    Hedge Funds were founded in in 1949 with Alfred W. Jones, launching the first ‘hedged’ fund with $100,000 of capital, ($40,000 of his own contribution). Jones enacted the thesis of holding positions of stocks over the long-term, and having positions in stocks and short selling them, creating the L/S model. Hedge funds took off in the 1990s when interest in mutual funds abated, in conjunction with a favourable dotcom boom fuelling the 1990s equity bull market. Plus, George Soros’s short against the pound (borrowing the pound and selling it) through his hedge fund Quantum Fund. This trade earnt a $1 billion in one day in 1992. This garnered attention to hedge funds, as his $10 billion trade forced a devaluation of the pound and earnt Soros the title of the man who broke the Bank of England.

    • How they trade: 

    Breaking down the name of Hegde Funds, they are intended to ‘hedge’ to off-set risk, keeping volatility to a minimum – to achieve alpha. Hedge funds are not intended to beat the S&P 500 per say, but achieve absolute returns, regardless of market conditions, hedge funds do not intend to ride the market up or down. 

    For instance, if the S&P returns 10% one year, and a hedge fund also returns 10%, but with a 0.5 beta, it’s the same return with less risk, its achieved alpha, which is risk adjusted for beta. 

    Hedge funds are accordingly given more autonomy over an investment bank, but in tandem with this, risk needs to be managed with very tight risk controls. This pertains to oversight on net exposure, factor exposure overlap, correlation matrices, and resultantly fast capital reallocation in a drawdown (losing position). 

    Hedge Funds operate using 3 main concepts: 

    1. Beta –  Beta is a measure of how much an investment or portfolio moves relative to a market benchmark). A fund will monitor its beta of it positions to control. A fund may want to focus on alpha, so may neutralise beta to hedge exposure. Or a fund may target beta to amplify returns. 

    Beta of 1 = moves in line with the market. 

    Beta > 1 = more volatile than the market. 

    Beta < 1 = less volatile than the market. 

    Beta = 0 uncorrelated to the market. 

    • Sharpe Ratio – this ratio is a measure of return per unit of total risk. A fund with a higher shape ratio will deliver more return per unit of total risk. The Sharpe ratio can indicate whether the raw returns are driven by high beta exposure, or returns due to actual skill. 

    • Alpha – Alpha is a measure of the excess return a portfolio will generate relative to its expected return based on market exposure.

    Alpha > 0 = portfolio outperformed what was expected give its market exposure. 

    Alpha < 0 = underperformed relative to market exposure.

    Alpha = 0 = performance explained by market moves. 

    • Hedge Fund Performance in 2025 & going into 2026: 

    Hedge funds returns last year stayed effectively, and returning on average was 11.8%, a tiny down from 2024 where they were 11.9%, according to Goldman Sachs. The FT reported a slightly different figure of 12.8% for 2025, which would make it the wider industries best performance since 2009. 

    With best performers being healthcare (33.8% gains) and energy and materials (23.4% gains). The winning hedge funds from last year Reuters writes, are Bridgewater’s Pure Alpha with a 34% gain, D.E Shaws Oculus fund which surged 28.3%, while too its Composite find with 18.5%, and in third place Balyasny with 16.7%. North America leads the Hedge Fund industry, controlling more than 37% of the global AUM, Bloomberg advances. 

    The beta has crept up recently across the board for the industry, this is in comparison to MSCI world index of 0.24, in the previous 5 years, this has been noticeably lower at 0.15. With this augmenting beta, comes low volatility in comparison to the MSCI, carrying through at 2.43% whereas the MSCI world index vol was 9.25% reports BNP Paribas. The capital allocation looks to take a turn this year, with orientation towards Europe, 34% of allocators plan to divest to this geography, in tandem APAC a 30% rise expected this year, ideally equity L/S.* Barclays suggests that alpha was at just 50bps for 2025. 

    • The future outlook for hedge funds in 2026: 

    BNP Paribas reported that one-fifth (21%) of allocators advocate the trading strategy which will deliver the highest returns in 2026 is discretionary macro.* This strategy is ‘where managers construct portfolios based on their top-down views of the world’, a human analysis of changes and shifts across geopolitical events to make subjective and adaptable investment thesis’s according to WTW. This stands in dichotomy to systematic macro trading, which is based on algorithmic rules-based mode decision making, purports the FT. 

    The industry sees a shortage a single, CIO, vintage style macro managers, which is where a Chief Investment Officer is responsible for setting investment strategies and overseeing active portfolio management. An ingressing change also being observed, is offshore hedge funds (e.g. in the Cayman Islands or British Virgin Islands) is one of the largest and fastest growing segments in the industry.* Barclays in their 2026 outlook, published Hedge funds are expected to reach $5.4 trillion in AUM by 2026. 

    *Information based off BNP Paribas’ CIP survey of 246 allocators concerning funds equating to $1.1 trillion, reflecting a sample of the broader market. 

    Disclaimer: not financial advice. 

    Sources: 

    https://www.lseg.com/en/solutions/hedge-funds/podcast/hedge-fund-huddle/season-4-episode-1-centuries-strategy-a-conversation-with-man-groups-cio

    https://www.wtwco.com/en-ca/insights/2025/09/navigating-complexity-the-role-of-discretionary-macro-strategies-in-client-portfolios

    https://globalmarkets.cib.bnpparibas/2026-hedge-fund-outlook/

    https://www.ftadviser.com/partner-content/a87b45eb-3dc4-512c-b361-801613a3527d

    https://www.goldmansachs.com/insights/articles/hedge-funds-have-momentum-after-posting-double-digit-returns-last-year

    https://www.ft.com/content/edded97b-49ce-4deb-8f5d-b6cecf989bbe

    https://www.reuters.com/business/finance/de-shaws-flagship-funds-trump-market-volatility-beat-sp-500-2025-source-says-2026-01-02/

    https://www.investopedia.com/ask/answers/08/george-soros-bank-of-england.asp

    https://www.bloomberg.com/news/articles/2026-01-05/light-street-gains-37-in-big-year-for-stock-picking-hedge-funds

    https://www.hsbc.co.uk/wealth/insights/learn-to-invest/start-investing/what-are-hedge-funds/

    https://www.ib.barclays/our-insights/3-point-perspective/hedge-fund-outlook-2026.html#:~:text=As%20investors%20reposition%20their%20portfolios,can%20meaningfully%20outperform%20the%20index.

    https://resonanzcapital.com/insights/understanding-hedge-fund-quantitative-metrics-a-handy-cheatsheet-for-investors

  • 3 Defence Stocks to Watch: Rheinmetall, Kratos, and Elbit Systems
    • The Defence Industry in 2026: 

    Washington has a track record of being the largest spender on defence globally, accounting to 36% of outlays in 2025. In 2025 the global defence spending was $2.63 trillion, a $15 billion increase from 2024. The FT reported yesterday that the IISS has provided data that the US defence expenses are easing down, but the EU is increasingly surging its bill, with Germany being the main bulk. Germany overtook the UK in 2024 as having the second largest defence budget in NATO, with the US still despite the relative slowdown, expenses 10 times more than the UK. Germany now accounts for 21% of the global total spending on defence, in comparison to 17% in 2022. Within the EU, France trails behind as the third largest spender on Defence, who had a $70bn budget in 2025. 

    The UK which is set to accelerate its spending from 2.5% of GDP to 3% under his tenure. The UK government in its 2025 Spending Review expected the MOD bill to come to £62.2 bn in 2025/2026, surging to £73.5 billion by 2028/2029. 

    The Council and European Parliament reached a provisional agreement on the EDIP (European Defence Industry Programme). The EDIP plans to provide €1.5 billion worth of grants from 2025 to 2027, in aid to enhance Europe’s defence industry.

    Conversations at the beginning of this year around Venezuela, Greenland and Iran are set to spur a defence spending rally. 

    • Defence Composition Spending:

    The composition of Defence spending in terms of where it’s going has augmented over time. Using data from the Institute for Fiscal Studies, breaking down NATO’s UK’s spending, major equipment is set to make up 36%, as of June 2025, aside from personnel and infrastructure, the remaining 32%, entitled ‘other’, includes costs covering R&D, non-major equipment, and operations. Major equipment is set to keep increasing, with shrinking personnel and infrastructure needs. The stock recommendations are reflective of these trends and supply needs expected.

    A new avenue that can be capitalised on is the EU’s fresh commitment on space spending. Germany has the intention to spend $39billion and France $4.74billion by 2030 on space-based capabilities. The UK has further highlighted the necessity to divert funds to this opening by the nation’s Strategic Defence Review. Plus, NATOS’s Commercial Space strategy of 2025 advocated for loosened purse strings for what they term ‘commercially provided systems and services.’ The investment promotion is encouraged further by the EU defence representatives as the security of Europe wanes on US-provided space systems which Trump has autonomy over allocating to NATO. This renders this reliance unsustainable; the EU must build stronger space defence systems itself. 

    1. Rheinmetall 

      News came yesterday that the Düsseldorf arms company, who construct tanks and ammunition, is set to be selected by Germany’s defence ministry as one of 3 companies to supply kamikaze drones. This contract will initially be worth €296mm and could be augment further if delivery deadlines of the products are met and performance needs are satisfied. 

      Morningstar believes some key European stocks are overvalued, such as Saab. Except Rheinmetall, they purport still has some upside potential. This is due to the stock previously staying solid during last year’s ongoing Ukraine conflict and discussions around NATO’s future. Morningstar denotes a 4-star rating to the company, compared to Saab with a 1-star rating and BAE Systems with a 3-star rating.   

      The company is viewed positively by analysts with the large majority advocating a buy, no sells observed and a small number of holds. Deutsche Bank advocating this status under the precedent set here of strong projected organic growth for company going past the 2030s. Barclays has the same under rationale of Germany as a core funding source. Berenberg is the same due to large order intakes from bolstered defence spending budgets, supporting cash-flow visibility. The Average 12-month price target for analysts sitting at 2,127.253.

      In terms of risks, there are some valuation qualms; it trades a high forward P/E ratio of 42.55 well above its historical average, meaning much of the expected future growth may be already priced in. A downside of this to be aware of is the company must now deliver,; otherwise the P/E compresses and the stock falls hard. The beta (5-year monthly) is around 0.40, indicating the stock is substantially less volatile than the market, but this can be purely indicative of the defence sector having lower than usual betas due to defence the industry having a less cyclical disposition. 

      Other risks include the German Chancellor Friedrich Merz and the finance minister, stating that they have concerns that large manufacturers, of which Rheinmetall was named, will disproportionally benefit from their defence budget. They believed small highly specialised SME’s, which drive key innovations, should also receive adequate amounts in order to create ‘maximum spill over on the whole economy’, the FT reports. Overall, Rheinmetall appears a good long-term buy, but with some near-term volatility. 

      2. Kratos 

        Kratos Defence and Security Systems is a small/mid-cap US defence company, wwhich specialises in combat drones, hypersonic test infrastructure, and satellite electronics. It is positioned for affordable, high-performance mass systems. 

        The company has an attractive product portfolio, one of the few publicly traded drone combat enablers. The company published on their website on 26th of February, that they had won a contract worth $12.4 million, in unison with GE Aerospace, ‘to design a next generation engine for small Collaborative Combat Aircraft (CCAs). This is the development of its GEK1500, following the success of the GEK800, this new product has the potential to power unmanned aerial systems, missiles, and CAAs. Further, the WC-58A Valkyrie drone is still in early stages of its development, this will have to be watched to see is this product could be a profit driver. Kratos therefore stands in a great position to capitalise on incumbent demand aforementioned for space applications, with Germany, France, and the UK signalling needs to be met.  

        In terms of future growth, the caveat is that due to development of the product, the company is trading more symbolic of a venture-style public tech company. The risk is whether they stay experimental, and it doesn’t become a full procurement program. This can be negated by the strong record of contracts with the US Department of Defence (DoD), including the $1.45 billion 5-year contract to advance hypersonic testing, plus $68.3 million for a Hypersonic Materials testing facility. These locked-in repeat contracts are based on testing, equating to lower technical risk failure. 

        Regarding the most recent company financials for Q4 2025, they had revenue of $345.1 million, beating estimates by roughly 5%. Its operating margin is 2.93% and profit margin of 1.63%, which is low for defence. If you believe their drone capability can scale into large procurement and Kratos becomes, margins have the capability to double, reflective of their ‘unfunded backlog of $1.573 billion, indicating strong future revenue visibility’ according to investing.com. The high forward P/E ratio of 188/68 is also reflective of this. A usual forward P/E ratio for defence is 20-40, BAE systems sitting at 23.75, and Saab sitting at 45.25.  The stock is paying for profits that don’t exist yet. The markets are pricing in explosive profit earnings, however, if earnings don’t perform as expected the stock will drop substantially. The beta (5 year) is 1.09, meaning positioned above 1 it moves slightly more volatile (10-15% more) than the market average, but not extreme. Its only 1.09 despite the wild valuation, high P/E ratio as defence spending is relatively stable, and government contracts reduce the cyclicality of these stocks.  

        Overall, it’s a good stock to go long on if you believe drones scale into large procurement, margins double, it becomes a core autonomy supplier. It would be considered a less wise choice if growth stagnates at the demo stage, valuation compresses, and it stays as an experimental venture style company. All analysts are proposing a buy, with the average 12-month price target of 118.15, except a few outliers of holds coming from UBS and Piper Sandler, advocating a hold, yet no sells present.


        3. Elbit Systems 

        Elbit Systems is a large cap, Israel-based defence and electronics company, specialising in aerospace, land systems, C4ISR and electronics. Their key products include unmanned aerial vehicles (UAVs), including the Hermes 450, Hermes 900, and Hermes 650 Spark. These UAVs are driving its sales.  

        The company has a record-high backlog of orders, equalling $25.2 billion which has only been growing, with 69% coming from outside Israel, in Europe suggesting strong revenue visibility. A bounty of fresh contracts has been announced in February, covering $435 million for advanced land systems, $277 million for turrets and munitions, $100 for digital warfare, and $130 million for systems on helicopters, just this month. 

        The attraction of Elbit Systems is that adverse to Kratos and Rheinmetall, Elbit has a negative beta of -0.2 to -0.4, which is also rare for defence. Therefore, it is a diversifier in risk-off markets, this is attractive for portfolio construction providing a hedge. This can help shield capital if Rheinmetall and Kratos drop. This doesn’t mean this negative beta or Elbit systems is risk-free, if geopolitical risks in the Middle East, especially with Iran, trails into impacting delivery schedules, then this could shrink Elbit Systems’ valuation. 

        Divulging financials, compared to Rheinmetall and Kratos, the company has better margins, with a net profit margin at 5.91%, an adjusted EBITDA margin 10.5%, an operations margin between 5-8%, and a Gross profit margin 24.0%. Although these figures should be better for a large cap stock, with a market cap of 35 billion USD, especially one that’s defence. A good range for a net profit margin should be between 7-10%, EBITDA margin between 12-18%, operating margin 10-15%. Except for a defence stock, its gross profit margin is fairly good, Rolls Royce gross profit margin is 25.80%.

        You could say some of Elbit’s less ample financials, is reflected in its ratings, with a varied mix, but a mostly hold’s ratings suggested, coming from Morgan Stanley and BofA as published by Investing.com, with few buys. There are no active sells. 

        The sentiment of a hold appears to be the right ethos currently, reflecting on stats like its backlog order and its gross profit margin. If things took a turn into becoming a risk-off environment for defence, then Elbit Systems may be a good option. 

        Disclaimer: Not financial advice. 

      1. Blue Owl Company Profile – Fresh Redemption Halts 

        Blue Owl Capital is a leading US asset management firm, founded on the back of a merger in 2020, consisting of Dyal Capital founded in 2010, and Owl Rock Capital Group founded in 2016. Blue Owl specialises in private credit, GP stakes, and real assets, with $307 billion AUM, just about half of these assets sitting within Private credit.  

        Last week, the company put a stop in place to stop retail investors from exiting, i.e., withdrawing their money from a specific retail-focused private debt fund with a 12% concentration on software assets – OBDC II (Blue Owl Capital Corporation II). Why this matters – foremostly on a fund level, investors prior were able to pull their capital equating to 5% of the fund every 3 months, according to the FT. Secondly, these strong ruminations around this halt, is what it means on an optics level. It signifies something else wider for what CNN Business calls a ‘shadow banking’ industry. The size of the private credit industry was estimated to be $3 trillion at the start of 2025, compared to $2 trillion in 2020 states Morgan Stanley. It has been thought stress has been spreading within it for some time, signified by the major private credit players like Apollo, KKR, Ares and Blackstone all seeing plentiful drops, Ares fairing the worst second to Blue Owl, who is contestably now in light of recent events, in the eye of the private credit storm (shown below). 

        The FT writes how this bout of doubt stems from not just ‘falling rates and underwriting’, but sequestering capital heavily into software, which has high rates of project failure, rapid obsolescence, and able to be heavily tainted from AI happenings. The fall of Tricolor and First Brands in September 2025, both companies which received private credit are emblematic that this qualm is not just chatter but can easily be substantiated into real losses for banks, such as Barclays which took a £110 million charge. There is serious concern that private credit risk is systemic due to interlink with sell-side banks and insurers with the sufficing of revolving credit facilities. Moreover, not just idiosyncratic risk, as they pronounce themselves to be, based on their bespoke, illiquid, and lock-up structure – and instead, the private credit industry will become a financial locus of contagion. 

        This redemption standstill is also conjoined with a sell off by Blue Owl of 1.4 billion dollars of assets from three of the BDCs, with $600 million coming from OBDC II. 

        Nonetheless, the internal financials actually give a strong indication of a healthy company, efinancialcareers.com stated the firm ‘employs circa 1,365 people. Last year it paid them a combined $1.3bn in bonuses plus a further $765m in compensation from “fee related earnings”’. On top of this, the Q4 2025 data which was released on February 5th, shows they beat both top and bottom-line estimates, revenue was $755.6 million exceeding the forecasted $718.37 million, plus adjusted earnings per share up to $0.24, beating $0.23 predictions. These figures for the end of last year may soon be less persuasive of their health. Deutsche bank has downgraded Blue Owl from a buy to hold today, 24th February, along with lowering the price target from $15 to $10 dollars a share. The share price has dropped an alarming -42.36% over the past 6 months. With the company’s Q1 earnings set to be released in May, it will be interesting to see if despite all the changes, if behind the scenes the firm still maintains its financial soundness in the near future. 

        Disclaimer: not financial advice

      2. Trump’s New Temporary Tariff – The Impacts

        On the cusp of this past weekend, the US Supreme court announced the Liberation day tariffs from earlier on in the year – which were deemed reciprocal repercussions – lacked the judicial oversight in which to enact. Trump has in rebuttal, to what he purports to be a punitive degradation, over the course of the weekend, succumb to a 15% levy on imports in response. Trump has this ability to invoke this overnight change, which would come into force this Tuesday 24th, under section 122 of the 1974 Trade Act. The caveat of his comeback is that this blanket 15% import taxes on all countries, is that it would only be temporary for 150 days. After this time period, congress must grant approval. 

        This new temporary tariff is overall depicted as a negative turn of events, and it may be for markets, but for countries, i.e. who it directly affects in terms of trade, this is a substantial benefit and better case scenario than past infringements. The developing nations see the biggest win, and traditional US allies mostly developed countries, see a bigger hinderance than before, such as the EU and the UK. 

        The real winner is Brazil, who the FT report will see the biggest reduction in the tariffs rate they have experienced by 13.6%, and the second biggest by China at 7.1%, trailed thereafter by India, Canada, and Mexico respectively. Who prior, with the original tariffs, were some of the biggest losers.

        Since this announcement over the weekend, markets have reacted on opening immediately, the change can be seen covering Gold, the dollar, Bitcoin, and equities. 

        • Gold: 

        Gold over the past year has proven its historical sentiment ‘as good as gold’ still rings true. Its safe haven status has been evermore confirmed during another precarious political rumination, that it ais a stable asset to fall back on. Gold has risen following fresh tariff contentions on Monday, surging over 2% to reach above $5,118.70 for their spot open price, with the previous close at $5,108.255, according to Tradingview.com.  April futures open at $5,128.80 per troy ounce and are recording $5,228.90 towards the end of the trading day. 

        • Dollar: 

        The Greenback has held firm this Monday against sterling, with cable hovering at 1.27 throughout the day. Towards the latter half of the day there was a slight dip, but has remained stable towards the end reports Bloomberg, shown below. The same trading pattern follows throughout the day for Euro too. 

        The dollar remaining still may be due to tariffs signalling higher import prices, and there sticker inflation to come, potentially pricing out future rate cuts. Higher interest rates will usually mean higher intrinsic value of countries currency, therefore increasing demand for said currency, accordingly sustaining the dollars price. 

        • Bitcoin: 

        Bitcoin stood out as a key crypto asset which felt an impact, observing a downward pressure falling over 4.5% to below $65,000, following the immediate happenings mentioned. This comes theoretically as no shock, as Bitcoin is a risky flight asset, drawdowns reflect increased investor concern for the need for stability in the short-term. 

        This doubt should be expected to continue in the mid-term during the next 150 days for the length of these new tariffs. In addition, other news of US’s developing relationship with Iran teetering into more delicate territory, with nuclear talks set to resume. This leaves questions still in the air around the safety of risky assets like Bitcoin. US is set to meet Iran this Thursday; this will have to be watched and how it will circulate into markets. 

        • Equities

        A myriad of US indices have slipped into the red, ranging from the S&P 500 (0-.93%), Dow Jones Industrial Average (1.41%), and the Nasdaq-100 (1.15%), as shown below.  The Globe and Mail news outlet denoted how this overnight shift shows ‘how much uncertainty still hangs over the global economy’. 

        Nonetheless, the Hang Seng Index is a positive outlier, driven by optimism of the new 15% levy being an improved relative situation for China. The surges driven by Alibaba, Tencent and SMIC. The Nikkei 225 dropping as they stand to experience a worse-off situation than before with the new 15% denotation, while too the UK. 

        The EU, on behalf of the Trade chief, has denounced they will not accept trumps tariffs. They expect the US to honour its commitment laid bare in August 2025.

        The Telegraph proposes how this shakeup in equities, is coming in during a precarious time, one which will see the publication of Nvidia financials this week – a company that makes up 8% of the S&P 500. Equities alike to Bitcoin will need to paid attention to, in regard to the tariffs, but also in conjunction with incipient events to come over the next week especially.

        Disclaimer: not financial advice

      3. UK Inflation Down & Unemployment Up – What This Means for Markets

        The Office for National Statistics (ONS) reported today that the UK inflation has fallen to 3% for January, down from 3.4% in December. 

        The ONS believes this surge was caused by the cheaper cost of motor fuels and airfares, as well as a stabilising cost of meat prices. 

        UK overall unemployment has risen to 5.2%, the highest level in five years. This is coupled with youth unemployment rising too to 16.1% for 16–24-year-olds, also the highest level since 2015. The youth rate now stands higher than the EU’s, the first time in history since records began in 2000. 

        Why this youth unemployment number is a focal point, is that it is seen as diagnostic for an economy, as it is highly sensitive to business confidence and also very cyclical. 

        These two figures of unemployment and inflation are shifting the focus for the UK economy away from inflation risk to growth risk.

        Overall market consequences following these two indicators:

        • Rates likely down. 
        • Good for bonds. 
        • Mixed for equities. 
        • Slightly negative for the pound. 

        Interest Rates 

        Inflation dropping, now gives a clearer path for a rate cut to be imminent in March; an 80% chance recorded by money markets according to The Guardian, based on swaps contracts. The original consensus forecasted a rates cut, with a mixed bet between the timing of either March and April. The pessimism that April may still could happen instead, is due to the underlying pressure of services inflation. The FT reported services inflation is still looking sticky as it fell only 0.1%, to 4.4% from 4.5%.

        Unemployment being higher than expected gives an addition to this strengthening case for a cut at the March meeting. As youth unemployment signals business confidence, and overall unemployment gives an indicator of UK consumer confidence, and disposable income’s of working adults. 

        Gilts 

        When inflation is low, it is usually positive for UK government bonds (gilts). This is due to the tie inflation has to interest rates, which in turn impacts bonds. 

        Gilts fell slightly in reaction, with the 10-year gilt yields going down to 4.37%, the lowest since January 14th as observed by Tradingeconomics.com.

        When interest rates come down, and inflation also comes down, lower short-term gilt yields would be priced in, with a steepening yield curve. Long-term gilt yields should observe less of a reaction. 

        This is because gilts pay fixed interest (coupon) payments. When inflation falls the real value of those fixed payments rises. This means gilts become attractive, so investors are willing to pay more for gilts. Therefore, prices rise, and yields fall. In effect, lower inflation makes gilts more desirable as it means any money invested, retains more purchasing power. 

        This idea is embedded by a projection from Bloomberg which quotes that ‘UK bonds will rally in 2026…driven by Bank of England interest-rate cuts.’ 

        Increasing unemployment, generally aids as a catalyst for falling bond yields, (again, most prominently in the short-term). This is due to the link the unemployment rate has on interest rates, as discussed previously. As alluded to, high unemployment signals slower economic growth, which a cut in interest rates can aid in improving.  

        Equities 

        Equities see a tug of war between improved margins and potential revenue declines, when based on inflation and unemployment data. 

        Lowering inflation can act as a tailwind, as it should act as a boost for consumer confidence due to more disposable income. Lowering inflation on the other hand, can also be a mitigator to equity gains, if instead its consequence shows instead in the form of weakened consumer demand, and diminished corporate returns. 

        The impact unemployment data on equities also has a nuanced result. In the short-term, usually markets observe counter-intuitive rallies, via the interest rate channel. Since unemployment signals future rate cuts, and accordingly easier access to cheaper funding for companies and improved earnings, which shows up in the stock prices. However, in the earnings channel, this could dampen stock prices as companies should theoretically struggle, as they will be sitting within a weaker overall economy, meaning less consumer spending. Therefore, justifying the declaration of a ‘mixed result.’

        In the short term, the equities market has currently priced in a boost. The FTSE 100 closed at 10,686.18, up 1.23%, reaching a session peak on the 18th February of 10,715.77, as stated by Yahoo Finance UK. 

        Sterling 

        In the immediate aftermath of the announcement of the inflation and unemployment data, Reuters reports sterling has stayed steady against the dollar in the 1.3500-1.3600 range.

        For currency traders, a bigger ensuing situation that will be adhered to, is the growing political situation with the UK Primer Minister.

        However, over the long-term this could look slightly different. Inflation and unemployment figures could become stronger headwinds, causing sterling to weaken. This is due to the reduced rates prediction, accordingly a reduced yield for holding British assets. 

        Increasing UK unemployment, which is at a much higher rate than within the past decade, can push foreign investors away from the UK. They would instead be drawn to nations with stronger growth and economic stability, again weakening the pound and its attractiveness. 

      4. A buy-and-hold for Silver in 2026

        Since Liberation Day in April 2025, Silver has been on an uncharacteristic winning streak. A forgotten asset, barely teetering above $30 dollars per ounce for the past 5 years, liberation day caused a ruckus in this trend, and saw its price accelerating – even screaming past 120 dollars per ounce in the last few days of January. Now it’s just teetering above $70.

        Not just this, gold is down too. Gold reached over $5,500 dollars per ounce on the 29th January, this shift has caused gold to shave off $500 dollars per ounce, off its price. The other precious metals, palladium and platinum also saw a price dip, but less volatile than gold and silver

        Two words to answer for this predicament – Kevin Warsh. 

        The nomination of Kevin Warsh is very interesting. Warsh has a long and storied past with being a hawk on the balance sheet. He’s been vocal about wanting to bring the balance sheet down, as a form of passive tightening that can offset some loosening of monetary policy. 

        Back to the markets, they have, up until Warsh’s new job announcement, been betting on easy money, expecting the Fed to cut rates. Kevin Warsh has changed this sentiment overnight. Warsh is a known monetary hawk – he prioritises controlling inflation over promoting short-term economic growth or employment and is worried about the economy overheating. This gives some explanation for why gold has dropped, hawkish comments are seen as deadly for gold. So, a new Fed chair election who is adamant on this, can give clarity on why this drop has occurred.

        Silver has seen the biggest drop, and since last week, the largest struggle out of the four precious metals to rebound even slightly. Here is where this is interesting – while the markets, and investors are spiralling, and speculators who just bet on silver, because of its trend are now emptying out. Other global players are quietly using this dip to their advantage under the market’s nose. 

        These are China and Samsung.  

        China has enacted strict silver export restrictions on January 1, 2026. Changing silver exports to be license based; now only 44, state affiliated companies are even allowed to export the metal. This is on top of China’s 0.1% threshold law they brought in in late 2025, whereby foreign produced items made in China that contain 0.1% of Chinese controlled finite earth materials are subject to stringent export controls. These policies are in aim to grow domestic hordes of silver. 

        Why is this important. Silver has always been thought of as gold’s inferior alterative, this could be due to golds historical position during the gold standard system i.e. ‘as good as gold’. Silver has a unique combination of properties, it has the highest electrical and thermal conductivity of any element, a crucial element for solar power photovoltaic cells. It’s even hypoallergenic and used widely in medicine, and in cloud seeding, controlling forest fires and the weather. 

        Why it’s special, and this buy-and-hold belief is primarly driven by the energy transition – crucially batteries and EVs. Connecting this back to the aforementioned key player of Samsung and how they come into this. Samsung has made a breakthrough with an all-solid-state EV battery. The performance of the battery is revolutionary to the EV market, it could charge a full battery in 9 minutes to last 600 miles, surpassing lithium-ion battery capabilities. This battery would be made of a silver-carbon for the anode and a nickel-manganese-cobalt cathode. The silver composition of all solid-state batteries would need 1kg for per battery per EV, whereas the average battery right now for EV’s only needs about 25 grams. Since only 25,000 metric tons were mined in 2024 approx., and 22 million units of EV cars were built in 2025, with this figure set to be similar for 2026. The maths doesn’t add up here how silver will keep up with this demand. 

        As Morning Star reported, ‘China controls 70% of the silver that Big Tech, AI and solar power desperately need’. This means that if in the foreseen future, industrial demand picks up, China will control this market supply, if they keep building hoards which they are already attempting – thus, driving the price up. 

        The risks are whether the demand will maintain on the industrial manufacturing side. Projections are for the mass production of these all-solid-state batteries by Samsung is set to begin in 2027. Additionally, on a consumer level, whether the EV car market will sustain. Reuters published, that despite global EV registrations growing last year by 20%, this demand could lose pace, plus Q4 2025 EV were sales were observed to have decreased. Government policies could influence this situation as well. The UK has softened its Zero Emission mandate and hybrid allowance, whilst too manufacturers such as Aston Martin and McLaren have been made exempt from these mandate targets. 

        Nonetheless, the conviction expressed here still maintains, silver has shown how strong it can go now, breaking its former records. The main qualm for a buy-and-hold comes from volatility spikes, rather than if a substantial price hike could happen again.

        Disclaimer: not financial advice. 

      5. Key Economic Indicators Today for the UK (6th Feb 2026)

        GDP Growth: 1.4% (Nov 2025)

        R.GDP: $3.96 trillion (2025)

        GDP per Capita: $56,661 (2025)

        Quarterly GDP: 0.1% (Q4 2025)

        Inflation: 3.4% (Dec 2025)

        Base Rate: 3.75% 

        Market Expectation for base rate, year-end 2026: 3.25%

        CPI: 3.4% (Dec 2025)

        Core CPI: 3.2% (Dec 2025)

        CPI Monthly Change: 0.4% (Dec 2025) 

        RPI: 4.2% (Dec 202%)

        National Unemployment rate: 5.1% (Nov 2025)

        Average House price: £270, 493 (Feb 2026)

        Current account deficit: £10.5 billion

        Current account deficit % of gross GDP: 1.4% (Q3 2025) 

        Balance of Payments deficit: £12.067 Billion 

        Balance of Payments deficit % of GDP: 1.6% 

        Trade Deficit (excluding precious metals): £4.6 billion

        Trade Deficit (excluding precious metals) % of GDP: 0.6%

        Sterling to USD exchange rate: 1/1.36 (6th Feb 2026) 

        Sterling to EUR exchange rate: 1/1.15 (6th Feb 2026) 

        Labour productivity: 1.1% (Q3 2025)

        Real household disposable income Growth projection for 2026: 0.25% 

        SOFR: 3.65% (Feb 5th, 2026) 

        FTSE 100: 10,323 (Feb 6th, 2026)

        STR: 1.93% (5th Feb 2026)

        UK Government 10-year Gilt Yields: 4.53% (6th Feb 2026)

        Figures to watch and why: 

        • SONIA: 3.73% (Feb 2026). 

        SONIA essentially represents the foundation of almost all UK rate’s pricing. SONIA OIS curve embeds rate cuts, rate hikes, timing, and conviction, for consumers or influences mortgage pricing, debt hedging, bank funding costs. A rising SONIA means tighter financial conditions, and falling SONIA, credit loosens, and spending can follow. 3.73% is relatively high right now, but not at a peak seen during other times, but sill restrictive. 3.73% is around 175bps to 225bps above the neutral rate of 1.5-2.0%. SONIA is expected to come down somewhat for 2026. 

        • UK Retail Sales growth: 0.4% (Dec 2025) 

        Consumer demand trend shows real impact of inflation and rates, if volumes fall it can indicate if living standards are under pressure, and whether the base rate is too high. 

        • UK 2-year Gilt Yield: 3.61% (6th Feb 2026) 

        This rate is a short-term curve anchor it can influence 10 and 30-year gilts – indicating near-term rates, but long enough to give colour on future moves. A high 2-year yield can show markets are expect stronger growth or persistent inflation. Lower 2-year yields, markets expect flow growth, weaker inflation or easing ahead. Fiscal and political events moved 2-year yields immediately, and how market sentiment straight away. This figure is moderate to relatively high, this figure was below 1% post 2008 and post COVID but are lower than their peak in 2022-2023 of 4.5%. 

        • Consumer confidence GfK index: -16 (Jan 2026)

        Forward consumer sentiment reflects the spending of the nation, how people view their personal finances and broader economic prospects, which is up from a low in April 2025 of -23. It predicts future household spending, which drives and helps predicts the UK’s GDP. 

        • USD % of Global reserves: 56% (Q1 2026) 

        This indicator is important to pay attention for global FX markets and the UK in relation to sterling, and its value plus GBP % of global reserve currencies. The sentiment floating around right now is one which revolves around dollar debasement. This percentage has decreased from 65.3% at the end of 2015. 

        • Youth Unemployment (16-24): 15.9% (Nov 2025) 

        This is a less commonly quoted figure, but signals labour market health and social stability, and potential pressure on spending and economic growth. This figure is very high, compared to overall UK unemployment rate. This figure can in turn create ‘scarring’ effects for the economy, inhibiting on long-term career growth earnings.

        Disclaimer: Not financial advice

      6. Why did SOFR replace LIBOR?

        The Secured Overnight Financing Rate (SOFR) replaced the London Interbank Offered Rate (LIBOR) in the UK on June 30th, 2023. 

        The LIBOR rate was a formal benchmark that had been established since 1986. It was the average short-term interest rate between banks, which was calculated each day by the Intercontinental Exchange (ICE). The methodological calculation of LIBOR was called into question, speculating that banks were augmenting the LIBOR rate to benefit their own positions. 

        The LIBOR rate was structured where it could be maladapted, as the major banks would submit an interest rate that they thought they could borrow at, from other banks at various maturities. Since the rate they would submit was technically an opinion, it was not backed by tangible transactions. A bank could purport even a 0.01% difference from what it ‘should’ be, and this could even impact interest-rate derivatives for traders at their representative bank. During the run up to the global financial crisis, from 2005 to 2009, banks allegedly reported the LIBOR rate lower than their actual borrowing costs, which made them appear more financially stable to control perception about their financial health. 

        Accordingly, the FCA in accordance with the BofE decided to revamp this rate, along with the Alternative Reference Rates Committee in the US. 

        The result was creating a rate which was based on tangible transactions, in which to minimise credit risk distortions, offering transparency, and was nearly risk-free. Candidates choose a range of options, such as Ameribor (American Interbank Offered Rate), BSBY (Bloomberg Short-Term Bank Yield Index), ICE Bank Yield Index, but SOFR was eventually landed on as the suitable choice. 

        SOFR is based on overnight treasury repo transactions. There are over $1 trillion worth of transactions a day in treasury repo trades everyday – this is a measure very hard to manipulate and robust, and its public data available.

        Disclaimer: not financial advice

      7. The ‘Sell America’ Narrative

        A colloquialism floating around recently is one touted as ‘sell America’. This is in line with the growing assertion around dollar debasement. 

        The New York Times has reported ‘Sell America’ is in itself a new buzz trade, with investing.com purporting this rhetoric ‘will define 2026’. 

        Analysing this sell America narrative is paramount; Bloomberg has dubbed ‘even a hint of sell America rattles global markets.’

        Sell America is the concept that has emerged following Liberation Day in April 2025, which pertains to the selling off of American assets – USD, US equities and US treasury securities. By reducing exposure to these US tied assets, investors see greater intrinsic value, stability, and returns in other safe-haven assets. This ties in with why bullion has seen, what can only be described as an astronomical journey in the past 6 months. With gold shifting first, and silver trailing with more extreme price swings and high volatility, as evidenced by the iShares Silver Trust (SLV) which observed a YTD performance of 94% in 2026. 

        Investing.com is right in maintaining that sell America is a pressing issue moving forward this year, the dollar fell 9.29% in 2025 – its worst performance since 2017. Along with this, President Trump reignited contentions over Greenland over the past couple of weeks in January. His threats of a trade war to Europe on January 19th, 2026, saw the dollar slip in response. 

        This growing tension in markets around Greenland being a driver of a US sell-off, and too the political relationship with Denmark over their territory, can be confirmed as a growing predicament. This is seen by a $25 Billion Danish Pension Fund – AkademikerPension announcing on 20th January 2026, that they are divesting their entire portfolio of $100 million portfolio of US Treasuries.  

        This sentiment can cause a stir across global markets, due to the dollar’s presence as the central reserve currency globally and fabricate ripples across all asset classes and all other markets. Changing the dynamic of EM currency FX carry trades, pushing 10-year treasury yields higher, capital can leave US equities and find value in Europe. 

        To understand whether the sell America sentiment is backed by validity, the 90-day correlation between the dollar and the S&P 500 will have to be watched. If this correlation is indeed positive, it will affirm that investors are trading in all US assets at once, and worries are continuing to swell.

        The 30-year treasury yield is currently sitting at 4.896 – 4.90%; this could come lower if US inflation eases. Watching the 30-year yields, and if they sustain above 5% which will act as a critical threshold here. If they do this could prove that there is an accelerated capital flight due to fiscal concerns, and that Sell America has materialised beyond just noise. 

        Disclaimer: Not financial advice